
U.S. Census Bureau Releases Income and Poverty Estimates
The U.S. Census Bureau released Wednesday the latest findings from its Small Area Income and Poverty Estimates program.
The program provides an up-to-date, single-year income and poverty statistics for all counties and school districts — roughly 3,140 counties and over 13,000 school districts nationally.
The tables provide statistics on the number of people in poverty, the number of children younger than age 5 in poverty (for states only), the number of children ages 5 to 17 in families in poverty, the number of children younger than age 18 in poverty, and median household income.
At the school district level, estimates are available for the total population, the number of children ages 5 to 17 and the number of children ages 5 to 17 in families in poverty.

According to the Census Bureau, these findings are a combination of the latest data from the American Community Survey with aggregate data from federal tax records, the Supplemental Nutrition Assistance Program, Bureau of Economic Analysis, Supplemental Security Income, decennial censuses and the Population Estimates Program.
Highlights:
- Based on estimates for all 3,141 counties, 14.0 percent of counties (440) had a statistically significant increase in median household income from 2014 to 2015 when adjusting for inflation. In the same period, 1.6 percent (51 counties) had a statistically significant decrease in their median household income.
- Based on poverty rate statistics for all 3,141 counties, 1.5 percent of counties (46) had a statistically significant increase in poverty rates and 7.8 percent (244 counties) had a statistically significant decrease for all ages from 2014 to 2015.
- Among the 13,245 U.S. school districts, the median estimated poverty rate for school-aged children was 16.5 percent in 2015. Additionally, for all U.S. school districts 37.3 percent (4,935 school districts) had a school-aged poverty rate greater than 20.0 percent.
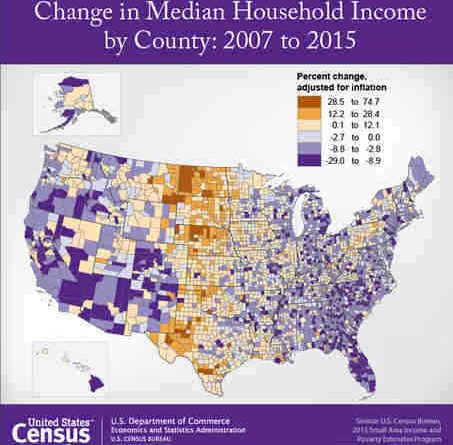
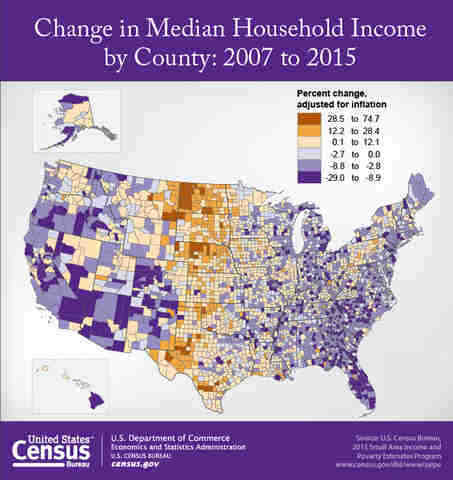
- Between 2007 (prior to the most recent recession) and 2015, 10.8 percent of counties (338) had a statistically significant increase in their median household income when adjusting for inflation. During the same period, 14.8 percent (464 counties) had a statistically significant decrease in their median household income.
- Between 2007 and 2015, 18.1 percent of counties (569) had a statistically significant increase in their poverty rate for all ages. During the same period, 2.0 percent (63 counties) had a statistically significant decrease in their poverty rate.
Statistics from the Small Area Income and Poverty Estimates program are an input to the allocation formula for Title I of the Elementary and Secondary Education Act, as currently amended.
Title I distributes funding to school districts based on the number and percentage of low-income children.
The U.S. Department of Education expects to use the 2015 estimates to calculate fiscal year 2017 allocations for Title I and several other Department of Education programs for use by states and school districts primarily in the 2017-2018 school year.
Support RMN News Service for Independent Fearless Journalism. Scan the following QR Code to Donate.

In today’s media world controlled by corporates and politicians, it is extremely difficult for independent editorial voices to survive. Raman Media Network (RMN) News Service has been maintaining editorial freedom and offering objective content for the past 15 years despite enormous pressures and extreme threats. In order to serve you fearlessly in this cut-throat world, RMN News Service urges you to support us financially with your donations. You may please click here and choose the amount that you want to donate. Thank You. Rakesh Raman, Editor, RMN News Service.